Energy, Greenhouse Gases, and Climate Change in the Twenty-first Century
Image: Bill Ebbesen via Wikimedia Commons
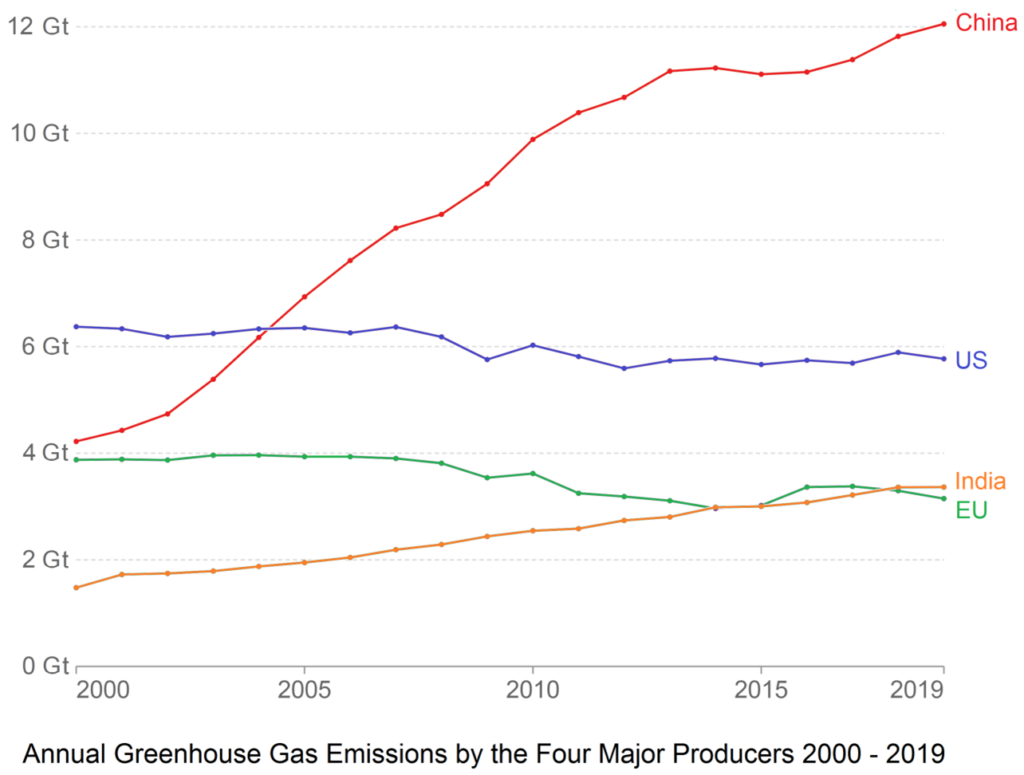
Climate and energy data is often presented in units that may be unfamiliar. But the units chosen here are intended to make comparisons simple. So, it is more important to notice, for example, that since the year 2000 the EU decreased its annual greenhouse gas emissions from 4 Gt to 3 Gt than it is to know what a “Gt” is, but a full explanation of these units follows at the end of this section.
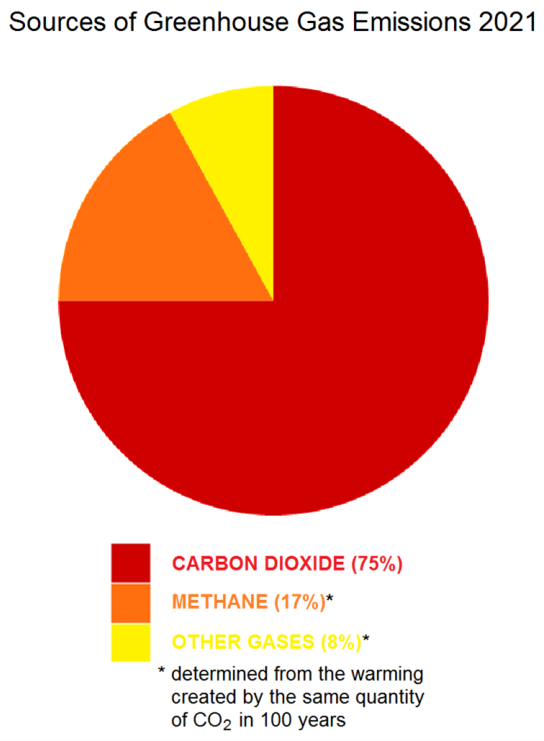
Humans emit about 40 Gt (gigatons) of CO2 each year. Activities like clearing forests and making cement also increase CO2 levels, and certain other activities produce additional greenhouse gases, such as methane, that add the equivalent of another 10 Gt of CO2 emissions.
Half of CO2 emissions are absorbed by vegetation and the oceans. But much of the CO2 absorbed by the oceans becomes dissolved carbolic acid, which is changing the chemistry of seawater and destroying marine life.
Sea levels are rising about 4 cm (1.5 inches) every ten years because of the enormous quantities of water from the melting of glaciers and polar ice caps as well as from the expansion of the sea water as it warms.
Of course, greenhouse gas emissions produce other negative effects as well, such as drought and extreme weather. And all of these changes are speeding up.
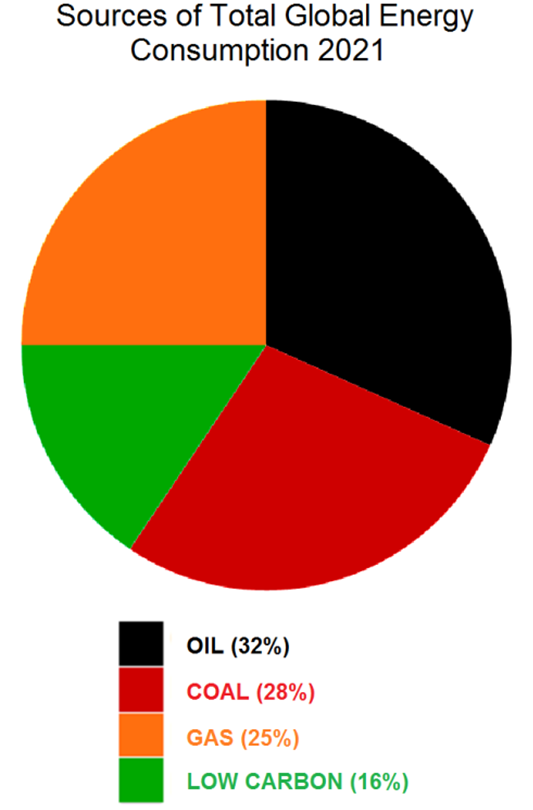
In 2021 the world consumed 168 PWh (Petawatt-hours) of energy. Most of this energy came from fossil fuels; only about 16% came from low-carbon sources.
All fossil fuels add CO2 to the atmosphere. Coal releases the most. Very roughly. burning various types of oil produces about 75% as much CO2 as coal for the same amount of energy, while natural gas releases a little over 50% as much.
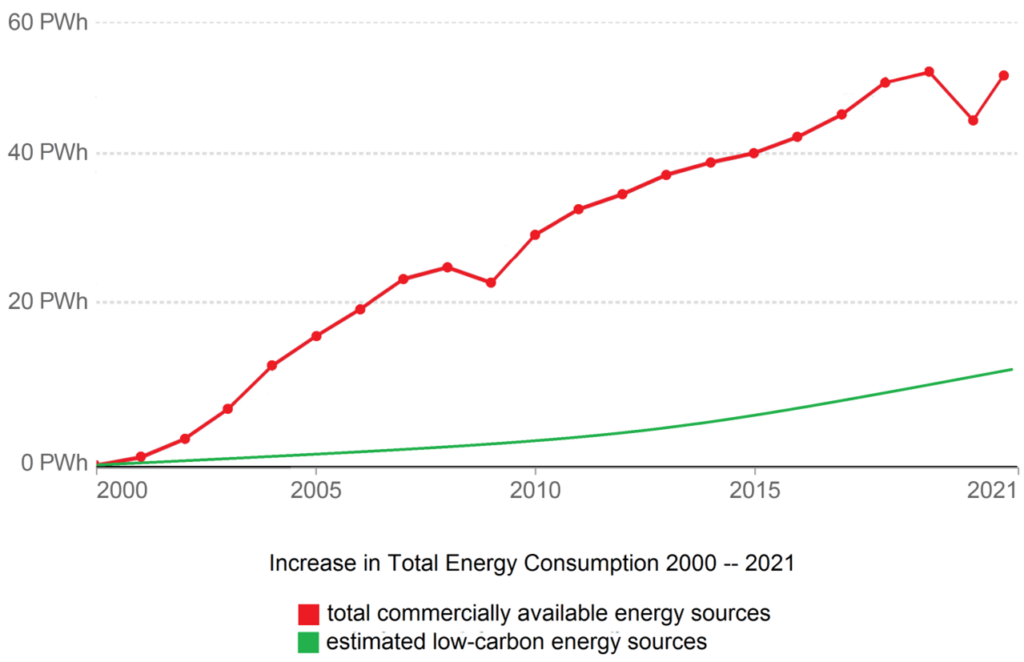
To approach the goal of net zero greenhouse gas emissions by 2050, that 16% of energy from low-carbon sources must climb to very nearly 100%.
Between 2000 and 2024, global energy demand increased by an astonishing 93%. Of that consumption, 38% could be attributed to renewable sources and 8% from nuclear. However, the remaining 54% still comes from fossil fuels. While energy from wind and solar has increased rapidly since 2000, total low-carbon energy has increased more slowly because the share of total energy from nuclear power has decreased.
Many people consider nuclear energy to be controversial, but nuclear energy produces very little carbon and is among our cleanest energy sources. Unfortunately for the climate, many of the new sustainable energy sources replaced nuclear energy rather than fossil fuels.
Western industrial nations have been gradually decreasing their greenhouse gas emissions since 2000. But during the same period developing regions, especially China, have greatly increased their coal consumption and greenhouse gas emissions, more than offsetting the modest reductions in the West.
But as we will see, these numbers are not as simple as they might at first appear. The reports that follow examine more closely the energy use, greenhouse gas emissions, and plans for developing low-carbon energy in major consuming regions.
Energy vs. Power
Energy as discussed here refers to “primary energy,” meaning all forms of energy produced commercially, including the energy expended to transport and convert fuel into the form in which it is finally consumed. In this way energy consumption and energy production are essentially equal.
Energy is usually expressed in units that make sense for how it’s used. For example energy for transportation is often measured in barrels of oil and energy for heating in BTUs (“British thermal units”). Watts are most often used to measure electrical power and energy, but here we use watts as a measurement for all energy in order to make comparisons easier.
Energy is power generated or consumed over a period of time. So a watt is a unit of power while a watt-hour is a unit of energy—one watt of power generated or consumed for one hour. For example, a 25-watt light bulb left on for one hour would consume 25 watt-hours of energy.
To see how watts can make comparison easier, consider the human body’s energy consumption. We usually measure the energy of the food we eat in calories. Instead, consider that the body of an adult human uses about 100 watts per hour while awake, the same as a bright incandescent light bulb.
The table below includes the most common units of power and energy measurement, their abbreviations, and what they mean:
| Power | Energy consumed in an hour |
|---|---|
| 1 watt | 1 watt-hour (Wh) |
| 1,000 watts (1 kilowatt) | 1 kilowatt-hour (kWh) |
| 1,000 kilowatts (1 megawatt) | 1 megawatt-hour (MWh) |
| 1,000 megawatts (1 gigawatt) | 1 gigawatt-hour (GWh) |
| 1,000 gigawatts (1 terawatt) | 1 terawatt-hour (TWh) |
| 1,000 terawatts (1 petawatt) | 1 petawatt-hour (PWh) |
Greenhouse Gas Emissions
The use of “ton” here is shorthand for “metric ton,” more properly spelled “tonne” (2,205 lbs). A gigaton (Gt) is equal to one billion tons.
Sometimes emissions are measured in terms of carbon rather than carbon dioxide, especially when referring to absorption by seawater or vegetation. A ton of carbon is equivalent to about 3.7 tons of CO2 because the two oxygen atoms make the carbon dioxide molecule that much heavier.
The EPA offers a convenient conversion tool for converting energy and emissions into a wide variety of equivalent forms, for example how much CO2 can be saved by switching to LED lighting.
The data in this report are drawn from Our World in Data, which in turn selects data from the US Energy Information Administration, the World Bank, and similar reliable organizations. Values here are sometimes rounded off for simplicity. For complete, up-to-date data and precise values please refer to Our World in Data and its cited sources.
Methods for equating greenhouse gases to the equivalent warming effects of CO2 vary, depending on the applicable length of time. The method used here is also explained on the Our World in Data website.
IEA. Global Energy Review 2025. IEA, March 2025. Available online at https://www.iea.org/reports/global-energy-review-2025.
OurWorldinData.org. “Home Page.” Accessed June 4, 2025. https://ourworldindata.org/
Wiatros-Motyka, M., D. Jones, and N. Fulghum. EMBER Global Electricity Review 2024. Published online May 8, 2024, available at https://ember-energy.org/latest-insights/global-electricity-review-2024/