
The Human Footprint: The Causes and History of Climate Change
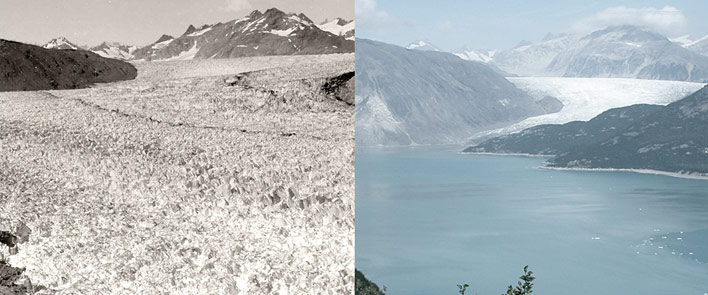
Muir Glacier, Alaska: August 13, 1941 and August 31, 2004 (NASA photos: William Field and Bruce Molnia).
Like other animals, on some level humans have always understood our dependence on the weather and the changing seasons. Modern climate science, a combination of many disciplines, has given us knowledge of how the weather and the seasons now depend on us, and about our own outsized impact on our finite planet.
Homo sapiens first appeared in Africa in the Pleistocene Epoch, between 350,000 and 260,000 years ago. Between 110 and 39 KYA, they spread into Eurasia, across to Australia and eventually into the Americas—a migration that largely coincided with and was likely spurred by the impacts of the last major glacial. By the end of the epoch, humans could be found in nearly every part of the planet. There can be no doubt that in this very recent period, our species has changed the face of the Earth.
Beginning with the Axemakers
In their landmark book, The Axemaker’s Gift, James Burke and Robert Ornstein tell the story of the Axemakers: the discoverers, inventors, and innovators, “who gave us our world in exchange for our minds.”
In our deep past—millions of years ago—they write, our ancestors made a Faustian bargain. Beginning with the rudimentary stone tools of Homo habilis and later the hand axes and cooking fires of Homo erectus, our forebears could hunt animals more efficiently, extract food from plants, and shape wood and bone into shelters. We found each successive gift that gave us the upper hand impossible to refuse.
It was our tools that enabled us to thrive in any land to which we migrated.
Not only did these tools give us power over the environment such as no other animal could wield, they changed the course of our evolution. Processing and cooking food softened it and allowed smaller teeth to evolve, leaving more room for larger brains and enabling speech. The disciplined, sequential processes that enabled us to create finely shaped axes, scrapers, and arrow points would shape our minds to develop language, logic, and rules. With fire, stone, wood and bone we broke free of the ecological niche that constrains the range and the numbers of every other species on Earth. Faced with changes of environment, over-hunting, or competition from other tribes, we spread across the Earth. Although we adapted physically in small ways through skin color and body shape to handle tropic or northern climate, it was our tools that enabled us to thrive in any land to which we migrated, that enabled the development of agriculture, mathematics, gunpowder, and the printing press.
The Scientific Revolution and the Age of Enlightenment
The Scientific Revolution marked an enormous leap in the axemaker’s power and ability to cut and control the world. It was traditionally assumed to start with the Copernican Revolution (initiated in 1543) and to be complete in the “grand synthesis” of Isaac Newton’s 1687 Principia. The primacy of religion and philosophical thought was challenged by the world of science and the scientific method: the systematic observation of problems, through measurement and experimentation, and the formulation, testing, and modification of hypotheses.
The advances in technology in the 17th century had parallels in economics. In 1692 Dudley published his Discourse on Trade. This quantified economics for the first time and led eventually to Adam Smith’s Wealth of Nations, published in 1776. Here Smith formalized the concept of division of labor. John Locke applied similar thought to society; he talked of the members of society in a mechanistic way, with the force of self-interest ruling each individual. America’s formation incorporated these ideas from the very beginning.
In a final, more general manifestation of its power, the scientific method also generated mechanistic attitudes in the political thinking of 17th- and 18th-century Europe. Knowledge of the universal law of acceleration, for instance, led people to expect that the progress of society would also accelerate with the passage of time. Astrophysicist Sandra Faber suggests that this notion of progress became humanity’s very purpose, the heart of our “centering cosmology.”
The Industrial Revolution gave the US more tools to cut and control, on a planetary scale.
In this view of progress, the principal aim of government should be to make sure that nothing constrains the natural force of self-interest. Since its most common expression was ownership of possessions, one responsibility of the state should be to protect individual property, leaving citizens free to concentrate on increasing their wealth, without regard for the finite nature of Earth’s resources.
These ideas, as expressed by Locke, would find their most powerful expression in the Americas, at the birth of the United States. The Industrial Revolution gave the US more tools to cut and control, on a planetary scale.
In the single generation after Newton, science and technology were already giving us a radically new view of nature by suggesting that it could be “improved.” As the full force of the Scientific Revolution began to take effect, the cutting edge of innovation became sharper and more finely honed than ever before. The new axemaker gifts developed in the Royal Society laboratories were spreading into society, giving governments and institutions the power to change the world with unexpected speed and in unprecedented detail.
New agricultural techniques made it possible to cultivate previously infertile or uneconomic land, which could now be made profitable enough to be cut up, cleared and then fenced for use. Enclosure was a more efficient way to use the land than the old-fashioned open field because it allowed more rational consolidation of property. The new-style farmers bought up strips of land from different owners, added newly enclosed areas, and assembled large, productive unified properties. These techniques were to have profound social effects because enclosure cut off the small cottager from his acres and the sharecropper from his common grazing rights. They would ultimately lead to the massive industrial farming practices that despite their benefits, now contribute to a host of environmental and health threats such as overpopulation, global warming, species eradication, groundwater depletion, and endemic obesity.
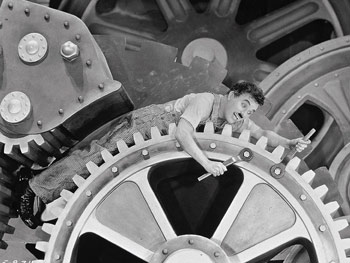
Capital was by now also generating major changes in social behavior as wages altered the nature of work and altered the relationship between worker and employer. Time and effort were increasingly measured not in terms of mutual responsibilities between employer and employee, but in terms of cash. As the system matured, it took the usual cut-and-control path. Manipulation of capital fragmented the production process, reducing workers to unskilled units of production that could be more easily controlled. A new kind of life was created: mindless repetition of meaningless tasks set to the speed of a machine. Steam power was the gift which made possible the execution of the new economy. It also made unskilled labor useful, which put large downward pressure on wages.
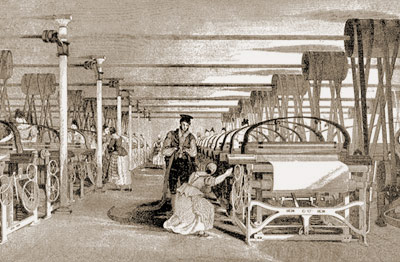
The Industrial Revolution that steam made possible would be the greatest of all axemaker triumphs so far in history, and it would change the entire world. The revolution began in the textile industries. The inventions of the day fed off of one another. The advanced spinning machine in 1769 automated the process of thread making. By 1812, there were five million spindles in England, with over 100,000 unskilled workers operating the new machines. By 1850 there were 250,000 steam-powered looms in operation.
In the mid-18th century, the axemakers had provided the means to change the shape of a tulip. Only three generations later their gifts were giving the West the means to change the shape of the planet.
Cumulative and Exponential Impact of Human Activity
Before the 19th century, about 80% of the world’s population were rural farmers, but the Industrial Revolution changed how people lived and worked, bringing millions to urban centers to work in factories. The revolution saw an incredible explosion in innovation. The coal-powered steam engine, internal-combustion engine, radio, automobile, and airplane were all born in or from technology developed in this time.
This period totally transformed our world and the way humans live, but it has also had big consequences. Perhaps the biggest has been the soaring consumption of dirty fossil fuel energy around the globe. As the concentration of carbon dioxide in our atmosphere has increased, global temperatures have also steadily increased. The amount of carbon dioxide in our atmosphere has gone up and down over time. But as a result of all the coal, oil, and gas we’ve burned over two-plus centuries, it is higher than it’s been for millions of years. We’re simply adding more carbon dioxide into our world than it can absorb.
Human Activity and Global Warming: A Brief History of Modern Climate Science
On some level, humans have always understood our dependence on weather and the changing seasons. The first scientific realization that the Earth’s climate might be sensitive to atmospheric concentrations of gases is centuries old. Modern climate science, a combination of many disciplines, gives us knowledge of how the weather and seasons now depend on us.
The first “scientific” realization that the Earth’s climate might be sensitive to atmospheric concentrations of gases is centuries old.
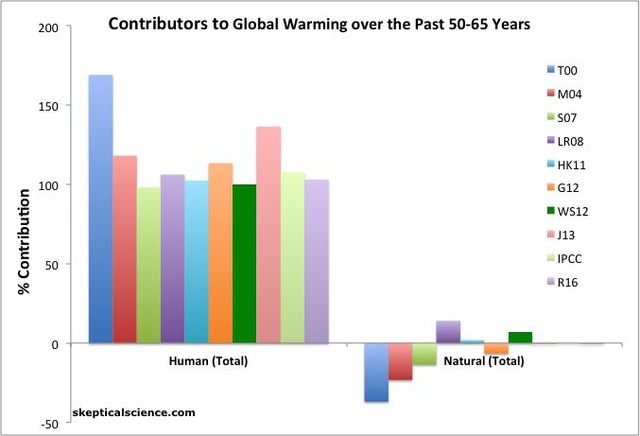
In his book Losing Earth, Nathaniel Rich tells the story of how scientists came to understand the link between fossil fuel use and global warming, the implications of that link, and the efforts of various stakeholders to drive meaningful public policy based on the science. Rich points out that the fundamental principles of global warming were on the table by 1979 and were likely better understood by the general populace then than now. Today, says Rich, “almost nine out of ten Americans do not know that scientists agree, well beyond the threshold of consensus, that human beings have altered the global climate through the indiscriminate burning of fossil fuels.”
The refinement of these principles has involved decades of ongoing research to understand the impact of the exponential increase in carbon dioxide in Earth’s atmosphere since the dawn of the Industrial Revolution—as well as to verify that the current pattern of global warming is a result of human activity and not a “natural” function such as a change in Earth’s orbit. The research has involved data from ice cores, satellite measurements of temperature, oceanic evidence, and the tedious work of collecting and normalizing hundreds of thousands of measurements from weather stations on land and sea.
Beginnings
Early 1600s—With the invention of the thermometer, we began to quantify and record the weather. By the end of the 19th century, systematic observations of the weather were being made in almost all inhabited areas of the world.
1760s—Horace Benedict de Saussure used a “heliothermometer”—panes of glass covering a thermometer in a darkened box—to demonstrate a process analogous to the greenhouse effect, the trapping of heat by gases in Earth’s atmosphere.
1860s—The Irish physicist John Tyndall, an early champion of Charles Darwin’s work, showed that coal gas (CO2, methane and volatile hydrocarbons) was especially effective at absorbing energy. He eventually showed that CO2 alone acted like sponge in the way it could absorb multiple wavelengths of sunlight.
1896—The pioneering Swedish chemist Svante Arrhenius first estimated the scope of warming from widespread coal burning. Investigating what would happen if CO2 levels were doubled, he suggested that global temperatures would increase by the same amount—5 degrees C or 9 degrees F. He foresaw this as a boon for agricultural bounty and “more equable and better climates, especially as regards the colder regions of the Earth.” Just four decades later, fossil fuel consumption had in fact increased beyond what Arrhenius could possibly have imagined.
Twentieth Century
1920s—Geophysicist Milutin Milanković discovered that periodic changes in the Earth’s orbit (Milanković Cycles) greatly influence the climate over thousands of years, resulting in ice ages and other changes. When it was later found that global temperatures were rising, it became a major research task to determine if the increase was due to a natural phase of the Milanković Cycle or to human activity.
1931—German glaciologist Ernst Sorge produced the first scientific study of ice cores following a two-year expedition to Greenland, a dramatic story of death and survival.
“Human beings are now carrying out a large-scale geophysical experiment of a kind that could not have happened in the past nor be repeated in the future.”
1953—Several major news outlets published stories about the work of the Canadian physicist Gilbert Norman Plass who had found that the planet may have already warmed by 1 degree C and warned that the worst was yet to come.
1956—A paper by Plass sponsored by the US Office of Naval Research, The Carbon Dioxide Theory of Climatic Change, predicted the increase in global atmospheric carbon dioxide levels in the 20th century and its effect on the average temperature of the planet.
1957—The scientist and presidential advisor Roger Revelle was among the first to recognize that alterations to the climate conditions upon which human society was organized would cause violent disruptions. A 1957 paper he co-authored with Hans Seuss described how the burning of fossil fuels adds carbon dioxide to the atmosphere. “Human beings are now carrying out a large-scale geophysical experiment of a kind that could not have happened in the past nor be repeated in the future,” they wrote.
The Keeling Curve
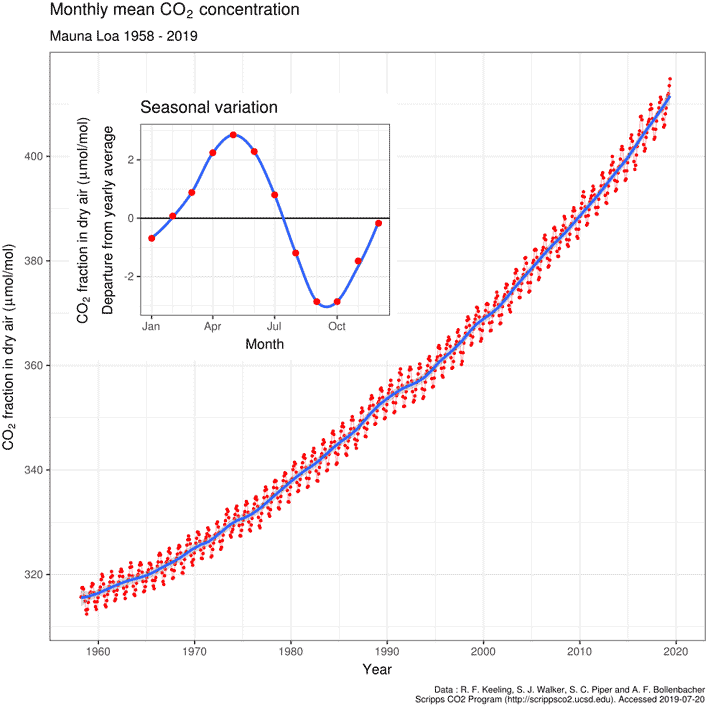
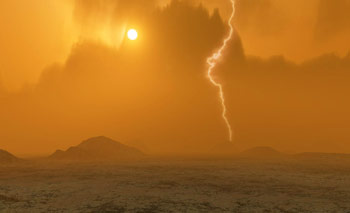
1958—Driven by the need for hard data, Revelle worked with the Weather Bureau to set up continuous measurement of atmospheric carbon dioxide from a site atop Mauna Loa on the Big Island of Hawaii, 11,500 feet above sea level. A young geochemist, Charles David Keeling, charted the Mauna Loa data providing the first true measure of the global carbon cycle, a continuous record of the burning of fossil fuel. He demonstrated that CO2 levels are rising in the atmosphere at a rate that could cause global temperatures to increase and the Earth’s climate to change. His graph, described by Rich as “a jagged lightning bolt hurled toward the firmament,” became known as the Keeling curve. It shows the increase in CO2 from 313 ppm in 1958 to over 400 ppm today, all from human activity.
1962—Measurements and observations from the Mariner II spacecraft indicated that it had been a runaway greenhouse effect that caused the planet Venus to lose its water and have a surface temperature hot enough to melt lead.
1965—After a decade of Keeling’s charting from Mauna Loa, Revelle took the data to President Lyndon Johnson who addressed the issue in his message to Congress, explaining that his generation had “altered the composition of the atmosphere on a global scale” through the burning of fossil fuels. His administration commissioned a Science Advisory Committee study led by Revelle. The resulting report, co-authored by oceanographer Wallace Broeker, was based on advanced computer modeling. It warned of the rapid melting of Antarctica, rising seas, and increased acidity of fresh waters—changes that would be “not controllable through local or even national efforts.”
In the 1960s it was also discovered that high levels of smog had been reducing insolation (the amount of sunlight reaching the ground) for more than 20 years. As clean air regulations such as those reducing acid rain began to be effective in the years following, insolation returned to normal and the underlying warming effects of extra CO2 in the atmosphere became apparent.
Also in the 1960s, scientists including Warren Washington at the National Center for Atmospheric Research (NCAR) and Syukuro Manabe at the National Oceanic and Atmospheric Administration (NOAA) were part of teams developing the first modern computer climate models; they have continued their work to evolve the technology over subsequent decades.
1977 and 1978—JASON, an elite group of scientists originally convened in 1960 by US Intelligence services to tackle national security issues, met to determine what would happen once the carbon dioxide in the atmosphere doubled from pre-Industrial Revolution levels. Their report to the Department of Energy, The Long-Term Impact of Atmospheric Carbon Dioxide on Climate, included dire findings: global temperatures would increase by an average of 2 to 3 degrees C; Dust Bowl conditions would “threaten large areas of North America, Asia and Africa”; plummeting agricultural production and access to drinking water would trigger mass migrations; rapid melting of the West Antarctic ice sheet could release enough water to raise the oceans sixteen feet.
1979—Under the Carter administration, the National Academy of Sciences was asked to do a full assessment of whether these warnings were justified. In July of 1979, under the leadership of Jule Charney, the father of modern meteorology, a group of the nation’s top oceanographers, atmospheric scientists, and climate modelers convened to review the science, aided by atmospheric physicist James Hansen, a leading expert on planetary climates and climate modeling. According to Rich, their report “considered everything known about ocean, sun, sea, air, and fossil fuels and had distilled it to a single number: three. When the doubling threshold was broached, the world would warm by 3 degrees C. The last time the world was 3 degrees warmer was during the Pliocene, three million years ago, when beech trees grew in Antarctica, the seas were eighty feet higher, and wild horses galloped across the Canadian coast of the Arctic Ocean.”
For every knowledgeable person involved in the climate issue, says Rich—from scientists, to government, to industry—the Charney report “was the summation of all the predictions that had come before and it would withstand the scrutiny of the decades that followed.”
Early Warning Signs
1980—The early 1980s would mark a sharp increase in global temperatures. Senator Paul Tsongas held the first congressional hearing on carbon dioxide buildup in the atmosphere and President Carter signed the Energy Security Act of 1980, directing the National Academy of Sciences (NAS) to start a multiyear, comprehensive study to analyze the social and economic consequences of global warming.
1982—Studies of ice cores collected in Greenland revealed the possibility of large climate changes taking place within the span of a human lifetime—a phenomena akin to the rapid onset of the Younger Dryas some 12,000 years ago. Within a decade, after thousands of years of warming from the last ice age, the planet slipped back into a 1,300-year glacial period that likely held back the development of human civilization by some 50,000 years. Later in the 1980s, Russian scientists risked their lives to collect ice cores in Antarctica that further illuminated the magnitude of the carbon dioxide added to the air, and the sensitivity of the climate to small feedback.
1983—The NAS commission’s study was released, stressing the importance of a swift transition to renewable energy with no time to waste.
1987—An independent commission chaired by three-time Prime Minister of Norway Gro Harlem Brundtland, often referred to as “the mother of the nation,” issued a landmark report, Our Common Future (or the Brundtland Report), that laid the groundwork for the UN Intergovernmental Panel on Climate Change (IPCC).
Also in 1987, following two expeditions to the Antarctic lead by atmospheric chemist Susan Solomon to study ozone depletion, the Montreal Protocol banned chlorofluorocarbons (CFCs) which, along with other halocarbons, were later recognized to be greenhouse gases thousands of times more potent than CO2. The Montreal Protocol remains a blueprint for possible international cooperation for regulating greenhouse gas emissions.
Founding of the IPCC and the Kyoto Treaty
1988—The summer of 1988 was the hottest on record, with widespread drought and wildfires. In a highly publicized congressional hearing, James Hansen testified that the warming trend could now be detected with 99% certainty.
Just four days after Hansen’s testimony, politicians from 46 countries convened in Toronto for the World Conference on the Changing Atmosphere. All four hundred scientists and politicians in attendance signed a statement calling for a 20% reduction in carbon emissions by 2005.
That same year, the United Nations unanimously endorsed the establishment of the Intergovernmental Panel on Climate Change (IPCC) to periodically assess consensus of the world’s climate scientists on the state of the climate and predictions for its future. The IPCC maintains three working groups to assess 1) the physical scientific basis; 2) the vulnerability of socio-economic and natural systems; 3) options for mitigation. The IPCC produces a comprehensive major assessment about every seven years and multiple specialized reports in between. The IPCC was also chartered with establishing a global climate policy accord to be agreed upon by all member countries.
1989—The Noordwijk Ministerial Conference, a critical milestone towards international emission targets for carbon dioxide, was attended by representatives of 67 countries, 11 international organizations, and the Commission of the European Community (EC). The resulting Noordwijk Declaration on Atmospheric Pollution and Climate Change resulted in a strong statement of concern but failed to produce a binding agreement.
1991—The first European Remote Sensing Satellite, the most effective tool for measuring changes to the ice caps, was launched. A sister satellite was launched four years later.
1992—Negotiation of the first IPCC accord continued for four years before it was finalized at the 1992 Rio Earth Summit, the largest gathering of world leaders in history.
1996—The IPCC Second Assessment reported a consensus on two key points: that global warming is probably occurring, and that human activity is more likely than not a significant cause. The cautious tone underscored the difficulty in making actual measurements of climate, but the report nevertheless provided a sound basis for preventative action.
1997—The first global agreement to reduce greenhouse gases, the Kyoto Protocol, was adopted, calling for reducing the emission of six greenhouse gases in 41 countries plus the European Union to 5.2 percent below 1990 levels during the target period of 2008 to 2012. Though signed by President Bill Clinton, the Kyoto treaty was never submitted to congress for ratification. Not until nearly two decades later, in 2015 under President Barack Obama, would the US sign onto another treaty on climate change, the Paris Climate Agreement.
1998—A special IPCC task force was created to standardize the methodology and oversee data collection and reporting on emissions and removal by countries participating in the IPCC and by signatories of the United Nations Framework Convention on Climate Change (UNFCCC).
1999—The climatologist and geophysicist Michael Mann and his colleagues published a report with the “Hockey Stick” graph showing the global mean temperature record of the past 500 to 2,000 years, the single most impactive illustration of climate change and atmospheric CO2 levels.
Also in 1999, marine ecologist J. A. (‘Joanie’) Kelypas and colleagues published the first of two seminal studies that made clear what had been basically ignored previously: the known acidification of the world’s oceans will have catastrophic effects on sea life if trends continue.
Twenty-First Century
2001—The IPCC issued its third report on climate change, saying that global warming at a level unprecedented since the end of the last ice age is “very likely,” with highly damaging future impacts.
2003—Stanford atmospheric scientist Ken Caldeira published a paper describing ocean acidification. His research showed that as a result of the high levels of human-injected CO2 in the atmosphere being absorbed by the oceans, seawater chemistry will change more in the coming decades than it has in the last 300 million years. That same year, The American Geophysical Union (AGU), the world’s largest organization of Earth scientists, also released a strong statement describing human-caused climate disruptions.
2005—The European Union Emissions Trading System (EU ETS) was launched, becoming the world’s first and still largest cap-and-trade market.
2006—Satellite data showed that Greenland was losing ice twice as fast as previously thought.
Also in 2006, former presidential candidate Al Gore weighed in on the dangers of global warming with the debut of his film An Inconvenient Truth (Paramount Vantage, 2006). Gore and the IPCC shared the Nobel Peace Prize in 2007 for public outreach about the threat of climate change.
2009—The future collapse of portions of the West Antarctic Ice Shelf was found to have become inevitable. East Antarctica, which had been considered stable, was also found to be losing ice. Data from the Eamian period of 120,000 years ago indicated the rate of melting would result a rise in sea level of about seven meters (20 feet), possibly occurring as soon as the next century.
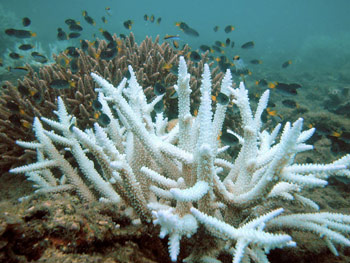
2012—Biologists reported that 50% of the Great Barrier Reef, the world’s largest coral formation, had died since 1985. Coral reefs are home to more than 25% of marine life; it is predicted that almost all of the world’s reefs will be gone by the end of this century.
2013—Average atmospheric CO2 levels surpassed 400 ppm (parts per million). Keeling’s initial reading in 1958 was 313 ppm.
2014—Climate modeling became the most publicized means of communicating to the public the risks of climate change; the Coupled Model Intercomparison Project (CMIP) was created to unite 33 separate computer modeling groups in 33 countries.
2015—The Paris Climate Agreement was signed by 195 countries pledging to set targets for greenhouse gas cuts and report their progress. The stated goal of the agreement was to prevent a global temperature rise of 2 degrees C (3.6 degrees F), which many experts considered to be a critical limit for avoiding more deadly heat waves, droughts, storms and rising global sea levels.
2016—NASA and the National Oceanic and Atmospheric Administration (NOAA) independently reported Earth’s 2016 surface temperatures to be the warmest since modern record keeping began in 1880.
2017—Satellite data showed that the rate of sea level rise has more than doubled since the turn of the century—over 8 inches since 1880, with about 3 of those inches gained in the last 25 years. When sea levels rise as rapidly as they have been, even a small increase can have devastating effects on coastal habitats. Already, flooding in low-lying coastal areas is forcing people to migrate to higher ground.
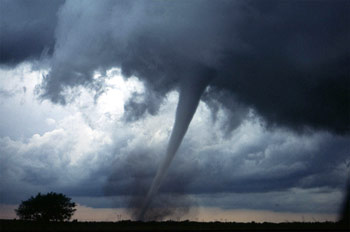
2018—Studies definitively linked specific extreme weather events to global warming, changing this from a generic understanding to actual cause and effect. The events include recent and unusually intense hurricanes, heat waves, floods, and wildfires.
2019—Two new studies showed that no previous climate event over the past 2,000 years was even remotely equivalent in degree or extent to the warming over the past few decades. The studies were based on a detailed global portrait of Earth’s surface temperatures compiled from multiple geological and biological sources including tree rings, coral endoskeletons, lake sediments, glacier ice, cave deposits, and the fossils of bivalve mollusks.
2020—The COVID-19 pandemic reduced carbon emissions by about 7%. Though temporary, this is the largest drop in emissions on record.
2021—The IPCC warned that without drastic emission reduction, a rise of 1.5 degrees Celsius above pre-industrial levels could be reached as soon as 2030.
2023–2024—The planet suffered its fourth and largest coral bleaching event so far, impacting 84% of reefs worldwide.
2024—The hottest year on record, and the tenth consecutive year this record has been broken. This is thought to be the first year that average global temperatures exceeded 1.5 degrees Celsius above pre-industrial levels.
Where We Stand
In the four decades since the 1979 Charney report became the still-standing baseline of settled climate science, how far have we come? The total amount of greenhouse gasses emitted—the number that truly counts—has continued its inexorable rise. More carbon has been released into the atmosphere since November 7, 1989, the final day of the Noordwijk conference, than in the entire history of civilization preceding it. In 1990, humankind emitted more than 20 billion metric tons of carbon dioxide. In 2024, this rose to a record high of 41.6 billion metric tons. With the exception of 2020, every year since 2010 has seen the highest levels of CO2 emissions recorded. Earth is now as warm as it was before the last ice age, 115,000 years ago, when the seas were more than twenty feet higher.
More carbon has been released into the atmosphere since November 1989, than in the entire history of civilization preceding it.
As David Wallace-Wells, author of The Uninhabitable Earth: Life After Warming, puts it, “more than half of the carbon exhaled into the atmosphere by the burning of fossil fuels has been emitted in just the past three decades. Which means we have done as much damage to the fate of the planet and its ability to sustain human life and civilization since Al Gore published his first book on climate than in all the centuries—all the millennia—that came before.” All of the reputable scientific agencies tracking and reporting on climate change continue to refine their research and release increasingly unambiguous reports and urgings. As the modeling becomes more precise and regional analyses sharpened, previous inaccuracies have inclined toward understatement, not overstatement. The consequences are significant. In 2018, a team led by physicist Drew Shindell tried to quantify the suffering that would be avoided if warming was kept to 1.5 degrees, rather than 2 degrees—how much additional suffering would result from just that additional half-degree of warming. Their answer: 150 million more people would die from air pollution alone in a 2-degree warmer world than in a 1.5-degree warmer one. The 2018 IPCC report went further: hundreds of millions of lives are at stake in that half-degree gap, the report said, concluding that “rapid, far-reaching” actions are needed to cap global warming at 1.5 degrees and avert the most dire, irreversible consequences for the planet. Meanwhile, there are increasing observable signals akin to the summer of 1988 that indicate we have already exited the ideal environmental conditions that allowed humans to evolve in the first place. As Ken Caldeira recently put it, “We’re increasingly shifting from a mode of predicting what’s going to happen to a mode of trying to explain what happened.”
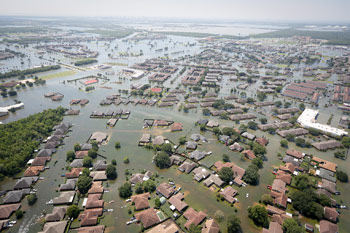
- In 2005, the category 5 Hurricane Katrina made landfall in Florida and Louisiana, causing catastrophic damage in the city of New Orleans and at least 1,836 deaths in the hurricane and subsequent floods.
- In 2016, a “thousand-year flood” drowned Ellicott City, Maryland, another flood followed two years later in the same small town.
- In the summer of 2017, three major hurricanes arose in the Atlantic at once. When it struck Houston, Hurricane Harvey delivered such epic rainfall it was described in some areas as a “500,000-year event”—that amount of rain could be expected to hit that area once every five hundred millennia. Harvey was the third such flood to hit Houston since 2015. As well as becoming more frequent, the storms are also bringing more water, causing more flooding.
- In the summer of 2018, dozens of places all over the world were hit with record heat waves, from Denver to Burlington to Ottawa; from Glasgow to Shannon to Belfast; from Tbilisi, in Georgia, and Yerevan, in Armenia, to whole swaths of southern Russia. The previous month, the daytime temperature of one city in Oman reached above 121 degrees Fahrenheit.
- In 2019, dangerous heatwaves continued to break records in the US. The intensity of India’s heat waves has increased in the past decade; in June 2019, temperatures in the Churu area of Rajasthan in northern India soared to 123 degrees. July 2019 became Earth’s hottest month ever recorded, quickly surpassed in July 2023 and then in July 2024.
- California’s 2018 wildfire season was the deadliest and most destructive on record with a total of 8,527 fires burning an area of 1,893,913 acres – an area larger than 10 states—the largest area of burned acreage recorded in a fire season. In November 2018, typically the beginning of the rainy season, the state was hit with the deadliest fire in its history. The Camp fire scorched several hundred square miles outside of Chico, killing dozens and literally obliterating the town of Paradise. This was on the heels of the state’s previous worst blaze just one year before.
- The 2019-2020 Australian bushfires burned up to 19 million hectares, making them some of the most destructive wildfires in history.
- In 2020, the Red Cross estimated that worldwide, already more refugees flee environmental crises than violent conflict.
- Floods in 2022 linked to above-average monsoon rains submerged much of Pakistan, affecting over 30 million and killing over 1,700.
- The extremely active 2024 Atlantic hurricane season was the first time multiple category-5 hurricanes occurred in a single season since 2019, resulting in damages estimated around 130 billion USD.
Writes Wallace-Wells, “if the planet was brought to the brink of climate catastrophe within the lifetime of a single generation, the responsibility to avoid it belongs with a single generation, too. We all also know that second lifetime. It is ours… If we allow global warming to proceed, and to punish us with all the ferocity we have fed it, it will be because we have chosen that punishment—collectively walking down a path of suicide. If we avert it, it will be because we have chosen to walk a different path, and endure.”
The Sixth Extinction
An Unnatural History
Elizabeth Kolbert
With all of Earth’s five mass extinctions, the climate changed faster than any species could adapt. The current extinction has the same random and rapid properties, but it’s unique in that it’s caused entirely by the actions of a single species—humans.
The Big Ratchet
How Humanity Thrives in the Face of Natural Crisis
Ruth DeFries
Human history can be viewed as a repeating spiral of ingenuity—ratchet (technological breakthrough), hatchet (resulting natural disaster), and pivot (inventing new solutions). Whether we can pivot effectively from the last Big Ratchet remains to be seen.
Our Choice
A Plan to Solve the Climate Crisis
Al Gore
We clearly have the tools to solve the climate crisis. The only thing missing is collective will. We must understand the science of climate change and the ways we can better generate and use energy.
The Future
Six Drivers of Global Change
Al Gore
No period in global history resembles what humanity is about to experience. Explore the key global forces converging to create the complexity of change, our crisis of confidence in facing the options, and how we can take charge of our destiny.
In the series: Our Finite Planet
Further Reading »
External Stories and Videos
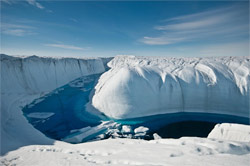
Greenland’s Ice Loss Septupled
Chris Mooney, Washington Post
The uptick is already affecting millions.
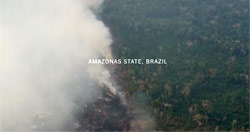
The Amazon, Siberia, Indonesia: A World of Fire
Kendra Pierre-Louis, New York Times
The growing intensity of wildfires and their spread to new corners of the globe raises fears that climate change is exacerbating the dangers.